Usage rate, aka NBA usage percentage, is an estimate of the percentage of team plays used by a player while he was on the floor. Usage rate can be calculated with how a possession ends: “field-goal or free-throw attempt, or a turnover.
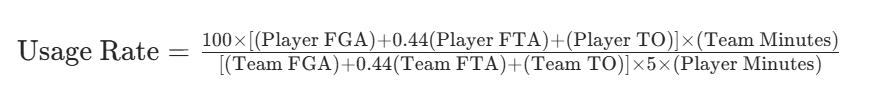
Usage Rate Calculation Formula
100*((Player’s Field Goal Attempts)+0.44*(Player’s Free Throw Attempts)+(Player’s Turnovers))*(Team’s Total Minutes)/
((Team’s Total Field Goal Attempts)+0.44*(Team’s Total Free Throw Attempts)+Team’s Total Turnovers))*5*(Player’s Minutes)
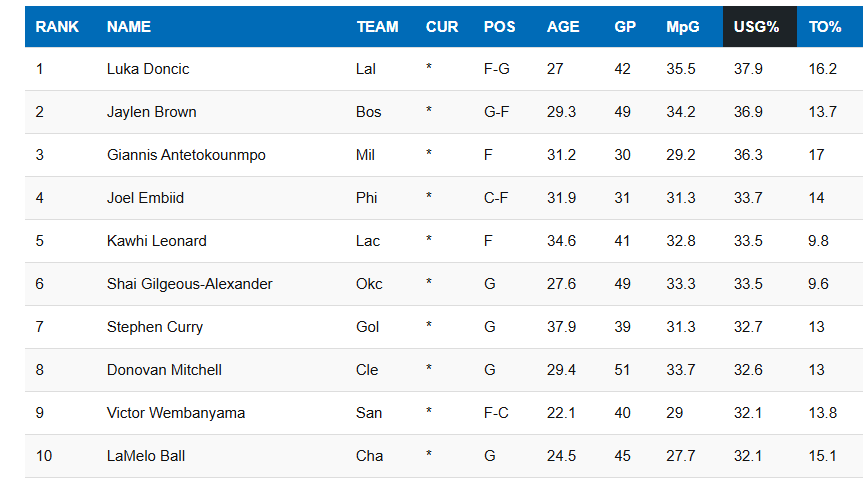
As you can identify on the chart, when a player is on the court, his usage rate indicates that he’s the primary option for his team. His possession is potentially ending with field goal/free throw attempts, or a turnover. But an offensive rebound give an oppurtunuty for another chance in the same possession. Head over to player stats tables to sort or filter players by usage rate values.
Is a higher NBA usage rate always a good thing?
A team must optimize its offensive output by balancing usage rates and the varying offensive ratings of the five players on the court.
The NBA stats show that, for all players, as the player uses more possessions, his efficiency decreases. One player who gets hot in the game can shoulder a larger proportion of a team’s possessions with only a relatively small drop in team efficiency. But the opposite is also true: Players perform more efficiently when they use fewer of their team’s possessions. Superstars with higher usage rates help supporting players maintain low usage rates, and this allows them to operate closer to their peak team efficiency.
Take the following players with different usage rates in the NBA:
- James Harden (2019-20 season): He has regularly had one of the league’s top usage rates. During his time with the Houston Rockets, he carried a big offensive load, taking a lot of shots, drawing fouls, and setting up his teammates. During the season, Harden’s usage rate was about 36.1%, suggesting that he was involved in more over one-third of Houston’s possessions.
- Russell Westbrook (2016-17 season): Westbrook is another player who has consistently rated near the top of the NBA in use rate. His aggressive style of play, which includes attacking the rim and pushing the pace, has resulted in excessive possession use. Westbrook achieved a historic triple-double average and had the greatest usage rate ever recorded for a single season in the 2016-2017 season, when he won the NBA MVP award.
- Klay Thompson (2017-18 season): Thompson, a Golden State Warriors shooting guard, has played with high-usage players such as Stephen Curry and Kevin Durant. While he is a good scorer and shooter, his use rate is lower due to his teammates sharing offensive responsibility. Thompson’s usage rate was at 20.2% during the 2017-2018 season, but his off-ball movement and ability to catch and shoot were critical to the Warriors’ success.
The usage rate is an important metric for assessing a player’s offensive activity and impact. To have a more complete understanding of a player’s contribution to the game, it should be studied alongside other aspects such as efficiency, playing style, and team chemistry. Players with lower use rates, on the other hand, frequently play more supportive or supplementary roles within their teams’ offensive systems. They may concentrate on efficient scoring, off-ball movement, and setting up teammates.