
Game Score is a player evaluation metric created by John Hollinger as a simple, linear alternative to his Player Efficiency Rating (PER). It boils a player’s entire box-score line down to a single number, making it easy to compare individual game performances at a glance. A Game Score of 10 is roughly an average NBA game, while anything above 40 is an all-time great performance.
Game Score Formula
Game Score adds and subtracts box-score statistics using weights Hollinger assigned to each action. Made shots, rebounds, steals, assists, and blocks add value, while missed shots, turnovers, and fouls subtract it.
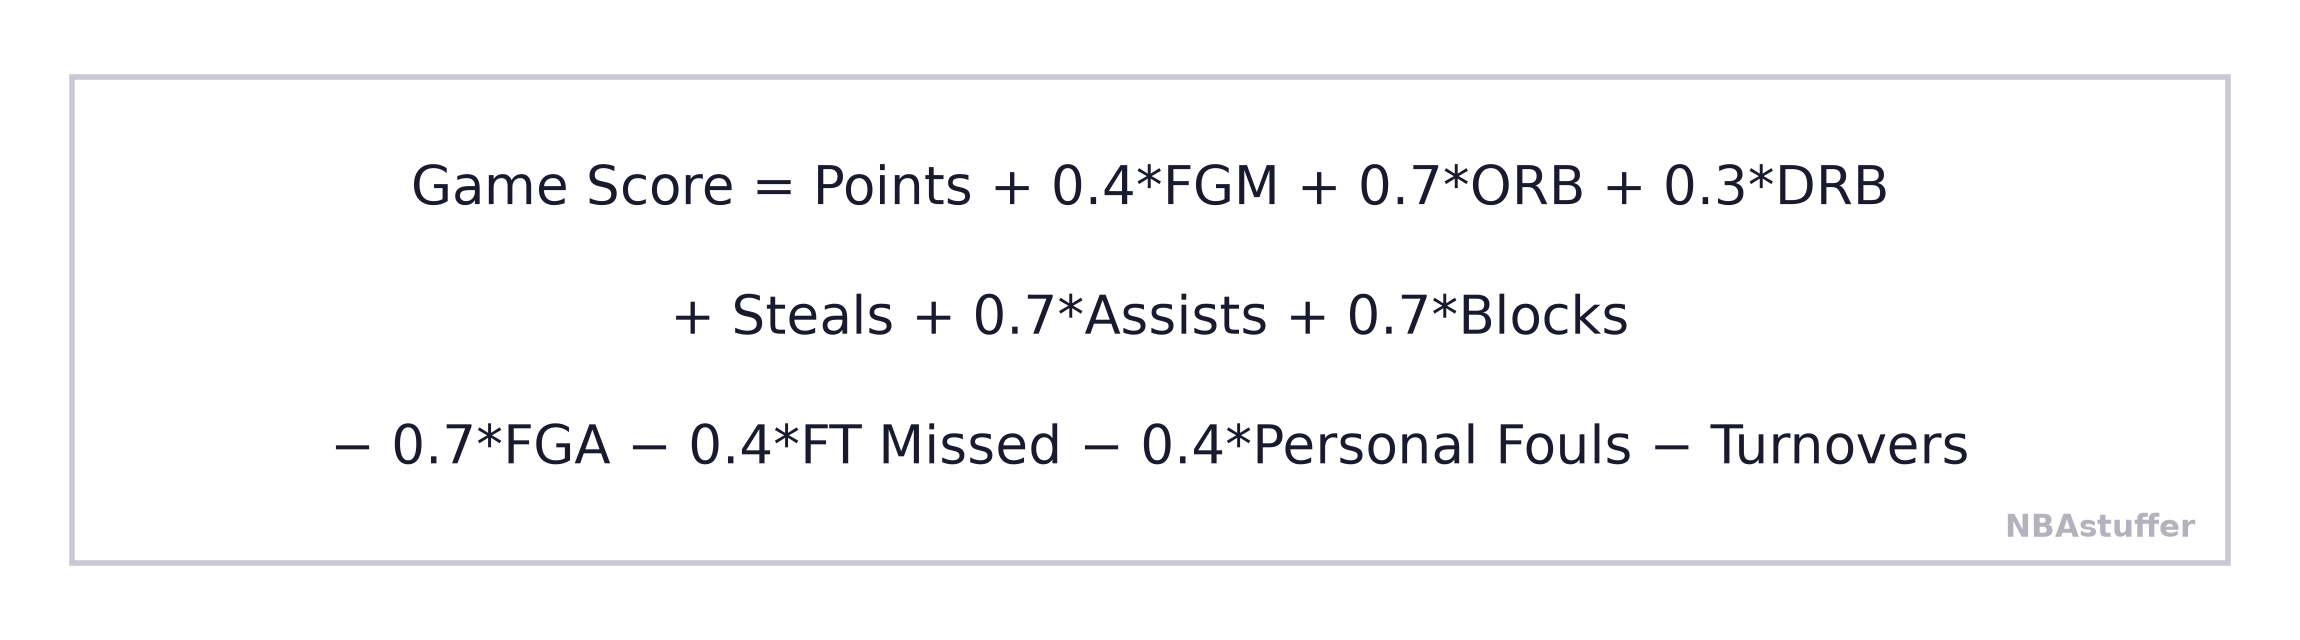
Unlike PER, Game Score does not adjust for team pace. It simply rewards productive actions and penalizes negative ones, which makes it fast to calculate and easy to interpret for a single game.
Game Score Examples
The best way to understand Game Score is to see it in action. Here are three worked examples using realistic stat lines.
Example 1: An efficient 30-point game
A guard scores 30 points on 11-of-18 shooting, adds 7 assists, 6 defensive rebounds, 2 offensive rebounds, 2 steals, and 1 block, with 6-of-7 free throws, 2 fouls, and 3 turnovers.
- Positive: 30 + 0.4*(11) + 0.7*(2) + 0.3*(6) + 2 + 0.7*(7) + 0.7*(1) = 46.3
- Negative: −0.7*(18) − 0.4*(1) − 0.4*(2) − 3 = −17.0
- Game Score = 28.4 (an excellent game)
Example 2: A high-volume, inefficient game
A scorer puts up 28 points but needs 26 shots to get there (10-of-26), with 7-of-9 free throws, 5 rebounds, 5 assists, 1 steal, 3 fouls, and 5 turnovers.
- Positive: 28 + 0.4*(10) + 0.7*(1) + 0.3*(4) + 1 + 0.7*(5) = 38.4
- Negative: −0.7*(26) − 0.4*(2) − 0.4*(3) − 5 = −25.2
- Game Score = 13.2 (a mediocre game despite the 28 points)
Example 3: An all-around triple-double threat
A forward fills the stat sheet with 22 points, 11 assists, 12 rebounds (3 offensive, 9 defensive), 2 steals, and 2 blocks on 8-of-15 shooting and 5-of-6 free throws, with 2 fouls and 4 turnovers.
- Positive: 22 + 0.4*(8) + 0.7*(3) + 0.3*(9) + 2 + 0.7*(11) + 0.7*(2) = 41.3
- Negative: −0.7*(15) − 0.4*(1) − 0.4*(2) − 4 = −15.9
- Game Score = 25.4 (a strong all-around performance)
How to Interpret Game Score
Because Game Score is scaled to a single game, it follows a fairly intuitive range:
| Game Score | Performance level |
|---|---|
| 40+ | Historic, all-time great game |
| 30–40 | Outstanding, dominant outing |
| 20–30 | Excellent, near-star performance |
| 10–20 | Solid to good, roughly average starter |
| 0–10 | Below average, limited impact |
| Negative | Rough night — hurt the team |
Game Score vs. PER
Game Score and PER were both created by John Hollinger, but they serve different purposes. PER is pace-adjusted and normalized so the league average is always 15, making it better for comparing players across teams and seasons. Game Score skips those adjustments, which makes it quicker to compute and more intuitive for rating a single game — but less reliable for cross-season comparisons. In practice, Game Score is best used as a per-game snapshot, while PER is better as a season-long measure.