
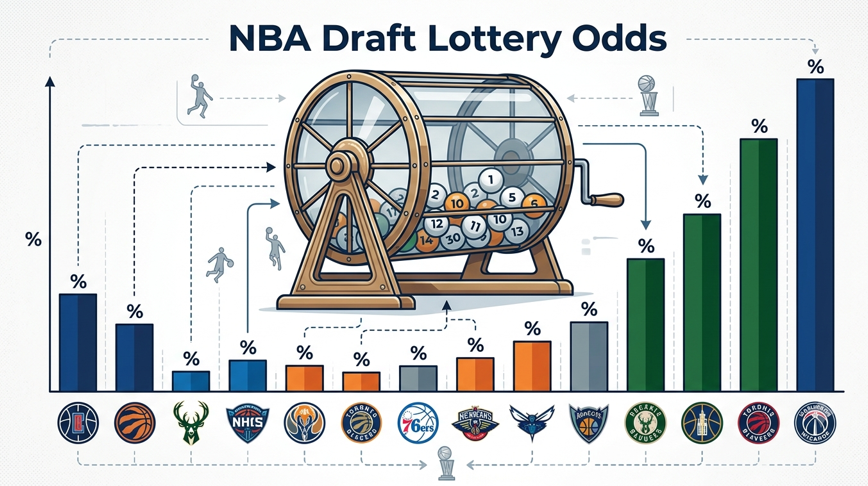
The NBA Draft Lottery decides more franchise futures in twenty minutes than most front offices decide in a decade, yet the actual odds behind it remain widely misunderstood. Fans quote percentages without knowing where they come from, and broadcast coverage rarely explains the machinery underneath. This breakdown covers how the lottery works mechanically, what every seed’s real chance at the No. 1 pick looks like, why the flattened odds system changed tanking math across the league, and how those probabilities shape trade value on draft night.
How the NBA Draft Lottery Actually Works
Before looking at any percentages, it helps to understand the machinery, because the lottery is not a simple weighted draw of team names. The process involves physical ping-pong balls, a fixed pool of number combinations, and a set of rules that determine far less of the draft order than most fans assume.
Ping-Pong Balls and Combinations
The system runs on 14 ping-pong balls numbered 1 through 14. Four balls are drawn, producing a four-number combination, and order does not matter. That yields 1,001 possible combinations, of which 1,000 are assigned to the 14 non-playoff teams and one is discarded if drawn. A team’s lottery odds are simply the share of those 1,000 combinations it holds:
- The three worst teams by record hold 140 combinations each, a 14.0% chance at the top pick
- The draw is repeated four times, determining picks 1 through 4
- After the top four, the remaining teams slot in by inverse record
That last point matters more than most fans realize. Only the first four picks are actually drawn. Everything from pick 5 onward is fixed by the standings.
When Is the NBA Draft Lottery and Why the Date Matters
The lottery typically takes place in mid-May, a few weeks before the draft itself. Lottery time has become an event of its own, with team representatives on stage and sealed envelopes preserving the reveal. The date matters strategically because it lands after the standings are final but before the combine and workouts fully reshape draft boards, so the odds conversation dominates the entire pre-draft news cycle.
Every Team’s Real Chance: The Full Odds Breakdown
Here are the numbers that matter, based on the flattened odds structure in place since 2019. The percentages below cover every lottery seed’s chance at the No. 1 overall pick, followed by the downside scenarios that receive far less attention but shape front office decisions just as heavily.
Odds at the No. 1 Overall Pick by Seed
The full distribution below shows each lottery seed’s probability of landing the first overall selection, from the three worst records down to seed 14.
- Seeds 1 through 3 (worst records): 14.0% each
- Seed 4: 12.5%
- Seed 5: 10.5%
- Seed 6: 9.0%
- Seed 7: 7.5%
- Seed 8: 6.0%
- Seed 9: 4.5%
- Seed 10: 3.0%
- Seed 11: 2.0%
- Seed 12: 1.5%
- Seed 13: 1.0%
- Seed 14: 0.5%
Read those numbers again with fresh eyes. The worst team in the league fails to land the No. 1 pick 86% of the time. Even its odds of a top-four selection sit near 52%, essentially a coin flip after an 82-game season of losing.
The Downside Risk Nobody Talks About
Because only four picks are drawn, teams can fall as well as jump. The worst team can drop no lower than fifth, but the math punishes the middle seeds hardest:
- The No. 1 seed falls out of the top four roughly 48% of the time
- Mid-lottery teams (seeds 5 through 8) jump into the top four far less often than fan bases assume
- A seed 10 through 14 team leaping to No. 1 is rare but real, which is exactly what keeps lottery night interesting
This is where tools like Tankathon and various lottery simulator sites earn their traffic. Running the simulation a few hundred times communicates the variance better than any percentage table, and it explains why “we have the best odds” and “we will probably pick first” are very different statements.
Why the Flattened Odds Changed Tanking Math
The current structure exists for one reason: the league wanted losing to pay less. The 2019 reform was a direct response to seasons in which multiple franchises openly raced to the bottom of the standings, and its effects on team building strategy are now measurable across several lottery cycles.
Before and After 2019
Under the old system, the worst team held a 25% chance at the top pick, and the incentive to bottom out was obvious. The 2019 reform flattened the top of the distribution, giving the three worst teams identical 14% odds and boosting the middle of the lottery. The practical effects show up in front office behavior:
- Racing to the absolute worst record now returns almost nothing over finishing third worst
- Teams in the 5 through 8 range have less reason to push for the play-in when a lottery jump is mathematically live
- The reform traded a strong tanking incentive for more variance, which is why recent lotteries keep producing surprise winners
Reading Odds Like an Analyst, Not a Fan
Understanding lottery probability is ultimately an exercise in expected value, the same discipline that applies anywhere odds are published. Bettors who evaluate gambling markets face an identical task of separating the stated percentage from the emotional read, which is why resources like Casino10, a guide that vets online casinos for safety and regional fit, put so much emphasis on understanding the underlying numbers before putting money anywhere. The lottery rewards the same habit. A 14% chance is not “probably,” and a 4.5% chance is not “never”. The same analytical mindset can also apply when looking at league economics, from draft probabilities to topics like NBA referee salary and how different roles around the game are valued.
What the Odds Mean for Draft Night Strategy
The lottery odds do not just decide one pick. They ripple through the entire draft board, shaping how traded picks are protected, how front offices price future assets, and how analysts should evaluate any deal built around a selection that has not yet conveyed.
Pick Protections and Trade Value
Because outcomes are probabilistic, traded picks carry protections keyed to lottery results, and front offices price those protections using exactly the percentages above:
- A top-four protected pick from a seed 3 team conveys roughly half the time
- Late lottery picks carry more certainty and therefore cleaner trade value
- Understanding the combination math is the difference between reading a trade correctly and repeating a broadcast talking point
The Bottom Line
The NBA Draft Lottery is a probability machine wearing a television special as a costume. The worst record buys a 14% ticket, nothing more, and the flattened odds guarantee that lottery night keeps humbling the teams that planned around it. Know the real percentages and the reveal becomes far more readable, no envelope required.