What does play-by-play data include?
Traditional box score data shows per-game totals for players and for teams and reveals only a fraction of what happens in a game and that the information therein is often misleading, especially at defensive stats. At this point, Play-by-Play (PBP) data has been the main source of many advanced stats such as adjusted plus-minus.
Play-by-play provides a transcript of the game in a format of individual events. A typical play-by-play data should have the following information:
+ The time of the possession,
+ The player who initiated the possession (in the case of a steal or defensive rebound,
+ The opposing player who initiated the possession (in case of a missed shot or turnover) including the location on the floor the shot was taken from, and some other unique identifiers we use to classify the type of possession.
How to access NBA play-by-play data?
Access to play-by-play data including shot distance & shot location (x,y coordinates), and lineup data that are available for past season and ongoing seasons. Datasets include separate CSV files for each game, and a season file in which all games are combined.History of play-by-play data
The NBA has been tracking play-by-play data since the 1996-1997 season.
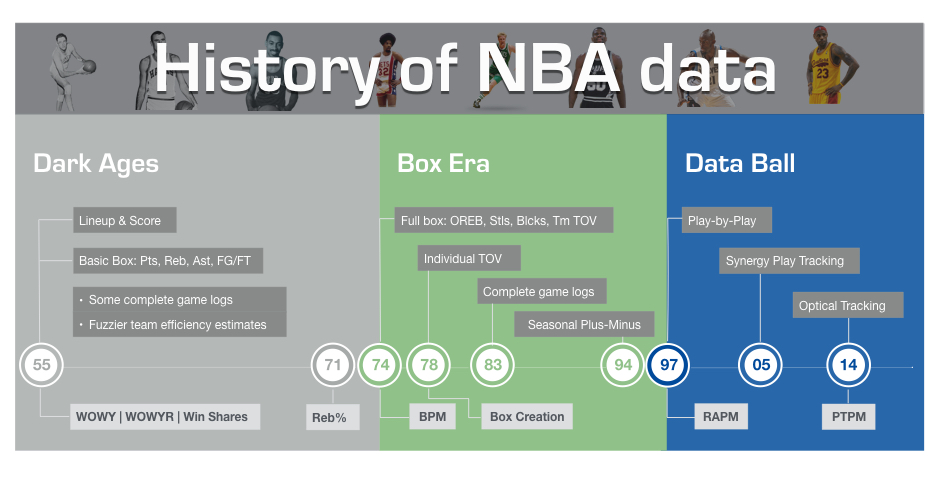 Chart courtesy of the great Backpicks.
Some analyses that you can do with NBA play-by-play data
Shot location and lineup data enables many analyses on shooting efficiency, playmaking, and defensive impact for teams and individual players. You just need to figure out the correct comparisons to work on.
- Analyze the impact of different five-man lineups on shooting percentage – see which lineups are associated with better or worse shooting.
- Look at the frequency of assists between different player pairings. See which teammates connect best for scores.
- Analyze shooting percentages off assists versus unassisted field goals. See which players are most effective catching and shooting versus creating their own shot.
- Analyze shooting percentages before and after substitutions occur. See if new lineups on the floor improve or dip shooting.
- Compare shooting from different zones (paint, mid-range, 3 point, corners, etc) by team and player. See who excels from where and create shot maps.
Visitors Interested in Play-by-Play Data Also Viewed